Business simulation analysis tool "iGrafx Process"


"Visualization, quantitative evaluation, analysis" business simulation tool for business improvement.
1. Realization of Business Visualization By covering all functions of the business process visualization tool iGrafx Process, it allows for easy and quick visualization of business processes. 2. Simulation Analysis With the business simulation feature, business processes can be repeatedly evaluated under various conditions. It enables the analysis of bottlenecks in business processes and the evaluation of the effectiveness of improvement proposals such as time-driven ABC analysis (TDABC). 3. Quantitative Evaluation The gap between the "current business" and the "ideal state" can be quantitatively captured from the simulation report. 4. Intuitive Operability No specific modeling methods or languages are required to build simulation models. Parameters such as starting conditions, processing times, and workforce can be input through an easy-to-understand property screen.
basic information
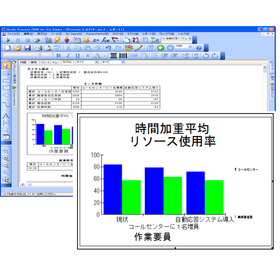
**Steps for Improvement from Visualization in iGrafx Process** Creating a process model → Defining scenarios → Reviewing report results → Validating process improvement proposals 1. **Creating a Process Model** Visualize the steps of the business (describing the business flow). For each job (activity) on the created flow, define the necessary working time, required resources, and costs needed to perform the task once. 2. **Defining Scenarios** Define when and at what timing jobs will occur, how many resources are available in total, and other operational schedules. 3. **Reviewing Report Results** When running the simulation, various statistical values are output in the report. You can check statistical data such as time, costs, resource utilization rates, and work delays (queues) in tables and graphs. 4. **Validating Process Improvement Proposals** By comparing multiple simulation results, you can determine how changes within the process affect performance. Check how much cycle time and costs can be reduced by changing the processing steps, increasing personnel, or adding equipment.
Price information
The price varies depending on the quantity, so please feel free to contact us.
Price range
P3
Delivery Time
P3
Model number/Brand name
iGrafx Process
Applications/Examples of results
Mainly, it is used in companies such as financial institutions, shared service companies, and outsourcing companies for the purposes of visualizing, streamlining, and standardizing administrative tasks.
Detailed information
-

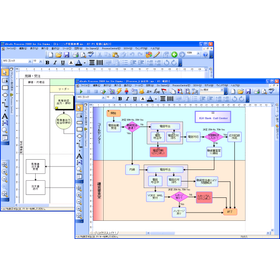
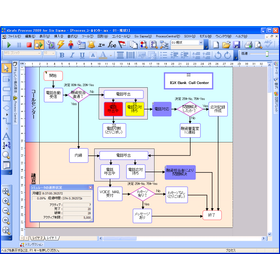
Creating Business Flows Equipped with all the features of iGrafx FlowCharter, you can easily and quickly map processes. The swimlane feature also allows for easy representation of departmental concepts.
-

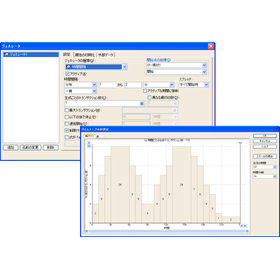
Business Simulation By simply changing business processes and scenarios, you can easily try simulations under different conditions. Since you can graphically monitor the movements during the simulation, you can intuitively identify the areas that are bottlenecks.
-

Report Output By conducting business simulations, it is possible to quantitatively output problem areas. It allows for a quantitative assessment of personnel allocation optimization, cost reduction, and a review of business processes, supporting the construction of optimal business processes.
-

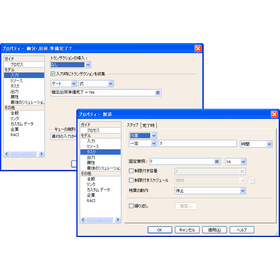
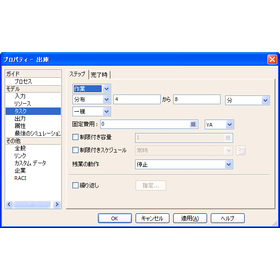
Setting various conditions for each activity You can input business-related conditions such as working hours, necessary resources like people and equipment, operational schedules, and costs from the property screen.
-

Input of scenario data The generated values for transactions can be easily input through fixed time intervals, random methods, or by creating a timetable.
-

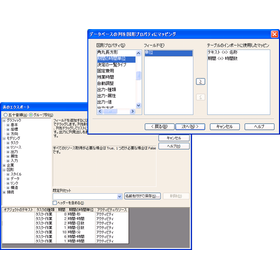
Importing and exporting activity data The main activity data of the described business processes can be output as a text file. Additionally, if the text file is edited in software like Excel, it can be re-imported as activity data for charts.
-

Guide Function The construction of simulation models has become faster. By using the guide function, you can easily build simulation models with minimal data input.
-

Data input from the application You can import data from a Microsoft Office Excel sheet and input it into the scenario generator. Data can be directly imported from the Excel sheet to create the number of transactions generated and the attribute values of the transactions.
Recommended products

Distributors

Our company is committed to improving the operations of various businesses through the solution of "visualizing business processes and workflows, and making proposals for operational improvements based on the various data obtained from this visualization." Specifically, we provide consulting using the business process improvement tool "iGrafx Process" across all industries. Our distinguishing feature is that we offer not just simple IT implementation as a solution to our clients' various issues, but also provide the optimal solutions to the challenges they face. For more details, please visit our company website. Thank you for your kind attention.